
VAPE FAQs
How Much Does It Cost To Vape Per Year?

Sep
It’s a question that rarely gets an honest answer: how much does it really cost, per year, to rely on a portable electronic device every day? The confusion isn’t accidental. Upfront price stickers and isolated component costs create a false sense of affordability, while the long‑term figure — the one that shows up on your credit card statement over twelve months — tells a very different story. Many adult users discover this gap only after they’ve settled into a routine, by which point the spending pattern is baked in.
This article is not about whether one device category costs less than another. It’s about how engineering decisions, usage patterns, and sourcing discipline combine to produce a number that varies far more than most people anticipate. We will break down every cost driver, show how design choices in devices like those in the ALIBARBAR ecosystem directly influence total ownership expense, and provide a framework you can use to calculate your own annual figure. A retailer with transparent sourcing, such as OZVAPE Shop, can make the exercise more accurate, but the methodology matters regardless of where you buy.
Understanding the Variables: What Shapes Your Annual Vaping Expenditure
If you strip away the marketing noise, the total cost of using a personal vaporizer over a year is determined by four interrelated factors. Each one is rooted in engineering, not branding. Once you understand them, you stop being surprised by the bill at the end of the quarter.
Device Lifecycle and Replacement Frequency
The single largest swing factor in annual cost is how long a device remains functional and satisfying to use. A low upfront price often masks a short operational life. Sealed units with non‑replaceable power cells are designed to be discarded once the integrated energy source depletes, which for many designs occurs within days or weeks of regular use. If you replace such a unit three times a month, the annual cost multiplies dramatically compared with a rechargeable architecture that remains viable for months or longer.
The difference isn’t about brand loyalty — it’s about physical architecture. Devices built around a rechargeable lithium‑ion cell and a replaceable consumable component (such as the ALIBARBAR INGOT 15000) are engineered to spread the cost of the power source across many cycles. Contrast that with a sealed unit where the entire assembly is discarded. Over a year, the rechargeable approach shifts expenditure from the device itself toward the consumable, typically resulting in a lower total outlay. However, that advantage only holds if the device’s thermal management and charging circuitry prevent early failure. Poorly designed rechargeable units can die prematurely, erasing the savings.
Consumable Consumption Patterns
Consumption volume is the obvious variable, but it is heavily influenced by device behavior. A device that delivers inconsistent output — one that feels weaker as the stored energy drops — often prompts the user to reach for it more frequently. This is a subtle cost driver. Engineering factors such as the flatness of the power curve and the purity of the heating element directly affect how predictably a device performs across its rated life. When the user trusts that each session will be identical, compulsion to double‑up drops, and consumption aligns more closely with actual need.
Consider the ALIBARBAR Ice Adjust 12000. Its adjustable output allows the user to match the intensity to the moment, rather than being locked into a single setting that might be too mild or too strong. This flexibility can moderate consumption because the user doesn’t compensate for a fixed, sub‑optimal level by taking additional draws. It’s a small engineering detail, but over twelve months, the effect on total consumable outlay is measurable.
Power and Accessory Costs
For rechargeable devices, the cost of electricity is negligible; what matters is the availability of compatible charging accessories and the reliability of the charging port. A device that uses a proprietary cable or has a fragile USB‑C socket can generate sunk‑cost accessories and downtime that prompt the user to buy a backup device. That backup device then becomes another line item in the annual budget.
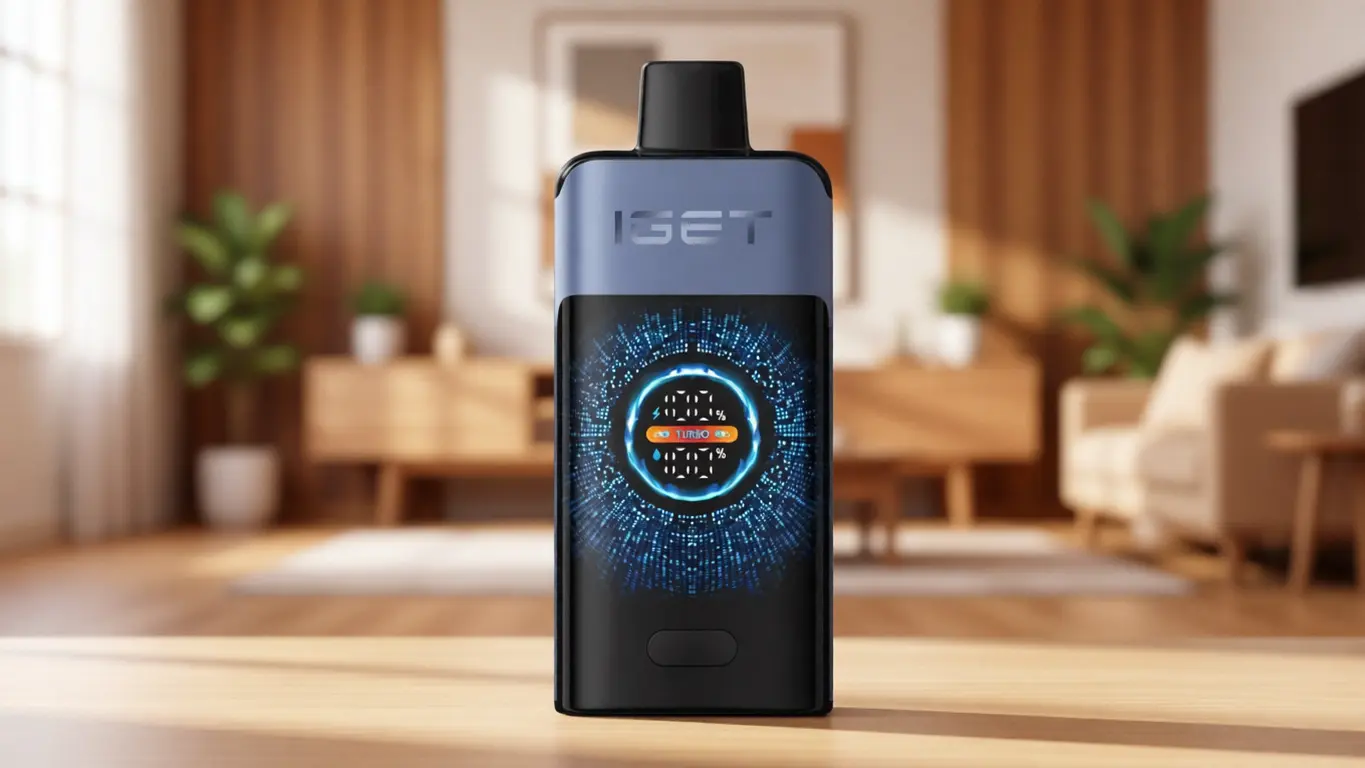
Status transparency plays a role here as well. A device that provides vague or no remaining charge indication forces the user to carry a spare “just in case.” That spare, even if rarely used, represents capital tied up in hardware that wouldn’t be necessary if the primary device communicated its state clearly. In the ALIBARBAR INGOT series, for example, a multi‑segment LED indicator removes guesswork, reducing the perceived need for a second unit. This is a cost saving that never appears on a spec sheet but shows up in the bank account.
Maintenance and Unexpected Failures
Not all devices fail suddenly; many degrade over weeks, with performance drops that the user slowly accommodates until the experience becomes unacceptable. This hidden degradation is particularly expensive because it often leads to premature replacement while the unit is still technically “working.” The underlying cause is usually thermal stress on the heating element or battery chemistry imbalance — issues that robust design mitigates.
Modularity further alters the maintenance cost profile. In a sealed system, a single failed component means the entire device is scrap. In a modular architecture like the ALIBARBAR platform, where the consumable section is distinct from the power base, a problem in one area does not necessarily kill the whole unit. This extends the useful life of the more expensive hardware and spreads its cost over a longer period.
Applying These Principles: Annual Cost Scenarios Across Different User Profiles
To ground the variables in real numbers, it helps to model a few typical usage patterns. The estimates below assume Australian market pricing for factory‑certified devices, such as those supplied through OZVAPE Shop, and realistic consumption rates. They are not projections — they are illustrations of how engineering choices translate into annual spend.
Light, Occasional User
Device choice: Rechargeable high‑capacity unit like ALIBARBAR INGOT 9000, replaced once every two months.
Consumable: Pre‑filled pod/cartridge section integrated into the device. Replacement pace defined by device lifespan.
Backup unit: None. Clear battery indicator removes guesswork.
Annual cost: Approximately AUD 360 – 480.
Moderate Daily User
Device choice: ALIBARBAR INGOT 15000, replaced roughly monthly.
Consumable: Integrated consumable consumed at a comfortable pace because power delivery is consistent.
Accessories: Standard USB‑C charging cable, no proprietary extras.
Annual cost: Approximately AUD 600 – 800.
Heavy, Continuous User
Device choice: ALIBARBAR Ice Adjust 12000 plus one backup, with replacements every three weeks on average.
Consumable: Consumption may be elevated, but adjustable output prevents over‑use triggered by dissatisfaction.
Backup cost: Carrying a second device adds upfront expense, but the transparent battery meter on the primary unit means the backup is rarely used.
Annual cost: Approximately AUD 900 – 1,200.
Contrast these figures with a sealed, non‑rechargeable unit replaced every three to five days: even a light user could easily exceed AUD 800 annually, while a heavy user might push past AUD 1,500 without gaining any improvement in experience. The difference is entirely attributable to the engineering decisions embedded in the device architecture.
A Practical Framework for Estimating Your Own Annual Cost
You don’t need to guess. A systematic approach, repeated once or twice a year, will keep you fully aware of where money is going.
Track actual replacement intervals for 30 days. Don’t rely on memory. Note the date each time you open a new device or swap a consumable section.
Separate hardware from consumable spend. If you use a rechargeable device with replaceable cartridges, log the cost of the base unit versus the consumable separately. A unit that dies after 10 days is mostly hardware cost; a unit that lasts a month shifts the ratio.
Include hidden hardware. Count any backup device you bought because you weren’t confident in the primary unit’s remaining charge. That’s a direct cost of poor status feedback.
Calculate cost per day of useful life. Divide the price of the device by the number of days it performed to your complete satisfaction. Ignore days you tolerated sub‑par output.
Annualize. Multiply your daily cost by 365. Then add any accessory or shipping costs you incurred over the year.
If this exercise reveals a higher number than expected, the cause is almost always one of the following: you are replacing devices more frequently than you assumed, you are carrying a backup that rarely gets used, or you are purchasing through sources that do not provide standardized, factory‑certified inventory — a scenario that introduces counterfeit risk, which we’ll address shortly.
Common Mistakes That Inflate Costs (Industry Observations)
Years of watching the market reveal patterns that individual users rarely spot on their own. The following are the most expensive errors, observed consistently across demographics.
1. Confusing category labels with technical specifications.
The term “disposable” is often used loosely to describe any device that isn’t rechargeable, but within that category, the difference between a unit rated for 3,000 puffs and one rated for 9,000 puffs is enormous. Yet price isn’t proportional. A heavy user who buys a cheaper, shorter‑lived unit thinking it’s equivalent may end up spending 40% more annually. The fix: always compare the rated capacity alongside the price, not the marketing language.
2. Assuming visual similarity means engineering parity.
Two devices may share an almost identical external shape, yet one contains a poorly regulated power circuit that sags under load, while the other maintains flat output until depletion. That invisible difference shortens perceived lifespan because the user discards the weaker unit earlier, mistaking performance fade for consumption. Authenticated channels like OZVAPE Shop help mitigate this by supplying only factory‑certified product, but the principle stands: never judge a device by its casing.
3. Overweighting upfront price while ignoring lifecycle.
A rechargeable device with an upfront cost of AUD 35 may seem expensive beside a sealed unit at AUD 15. But if the rechargeable lasts 30 days and the sealed unit lasts five days, the annual math is brutally clear: AUD 420 versus AUD 1,095. This error persists because people budget per transaction, not per annum.
4. Underestimating the cost of ambiguity.
There is a real, recurring expense associated with not knowing your device’s charge status. The “just in case” spare that lives in your bag or glovebox is a device you paid for, even if you rarely trigger it. It also represents a premature purchase you wouldn’t have made if the primary unit had transparent status indication. This is a design cost, not a usage cost.
Frequently Asked Questions
Q: Does a higher‑capacity device always result in a lower annual cost?
A: Not necessarily. Capacity reduces replacement frequency, but if you find the output unsatisfying and end up using the device more often, annual consumption cost can offset the savings. The sweet spot is capacity combined with consistent delivery.
Q: How do I verify that a device will actually last as long as its rated puff count?
A: Look for independent endurance testing or user reports that log actual days of use under normal conditions. A device with a well‑designed heating element and stable power output is far more likely to deliver its rated count than one with uncalibrated power management.
Q: Is carrying a backup device always a waste of money?
A: Not always. If your routine makes recharging difficult during the day, a backup is practical. The waste occurs when the backup exists solely because you cannot trust the primary device’s status indicator, not because of genuine logistical constraints.
Q: How do supply chain issues affect annual cost?
A: Purchasing from non‑authorized sources introduces the risk of counterfeit or mishandled stock that degrades faster. The few dollars saved per unit are repeatedly erased by premature failure. A verified supply chain — such as units sourced through an authorized retailer — removes that hidden tax.
Q: Should I buy the same device repeatedly or experiment with different models?
A: Switching models frequently can obscure your baseline cost because different architectures have different lifespans. Unless you’re deliberately trying to find a more cost‑effective option, consistency makes budgeting more accurate.
Q: What if my device starts performing poorly well before its rated life?
A: This usually indicates either a battery fault or thermal degradation. If purchased from a retailer with a documented return policy, you may have recourse. OZVAPE Shop, for example, handles post‑purchase issues directly with the customer, which can recover some of the lost value.
Q: Are there any hidden annual fees or membership costs?
A: No legitimate retail model for these devices involves recurring fees. Any subscription offering should be scrutinised carefully against your actual usage to determine if it locks you into over‑consumption.
Q: How does adjustable output affect cost?
A: Adjustable output can reduce consumption if you lower the intensity during periods when you don’t need maximum delivery. But if you consistently run at the highest setting, the effect is minimal.
Q: Is it cheaper to use a device that requires separate consumable cartridges versus an all‑in‑one?
A: It can be, but only if the base unit itself lasts long enough to amortise its cost. Modular systems like ALIBARBAR’s rechargeable platform spread the hardware cost over many cartridge cycles, which typically improves the cost profile for users who keep the power base for more than a few months.
Conclusion
The cost of using a personal vaporizer over a year is not a product of chance or brand loyalty. It is a direct consequence of design choices — how a device manages heat, reports its status, and structures its components — combined with the discipline of the supply chain that delivers it. A user who tracks their replacement intervals, separates hardware from consumable, and demands transparent status feedback will consistently spend less than someone who shops by upfront price alone.
That insight shifts the conversation from “which device is best” to “which device matches my actual routine at the lowest truthful cost.” When sourcing information, having access to standardised specifications from a retailer that deals exclusively in factory‑certified inventory — such as OZVAPE Shop — cuts through the confusion that inflates budgets. But the real power lies in the framework. Apply it, and you will know your number. From there, every purchasing decision becomes a deliberate trade‑off rather than a recurring surprise.